
The introduction of the continuous glucose monitoring (CGM) in people without diabetes has brought with it many opportunities, but was not without its challenges. Sometimes these two overlap as is the case with understanding what ‘normal’ is for people without diabetes.
Historically the understanding of glucose has been through the lens of blood and people with diabetes. Whilst this has been incredibly helpful and has application to people without diabetes using CGM we are starting to understand this context more and more.
Enter Supersapiens’ science team and their latest publication.
Whilst we have previously written about what ‘normal’ glucose data looks like during sleep, this paper examines the full day. Using data from 12,504 people with >1 million exercise events and >270,000 meal events the science team saw the following, the largest dataset published to our knowledge to date.
Range
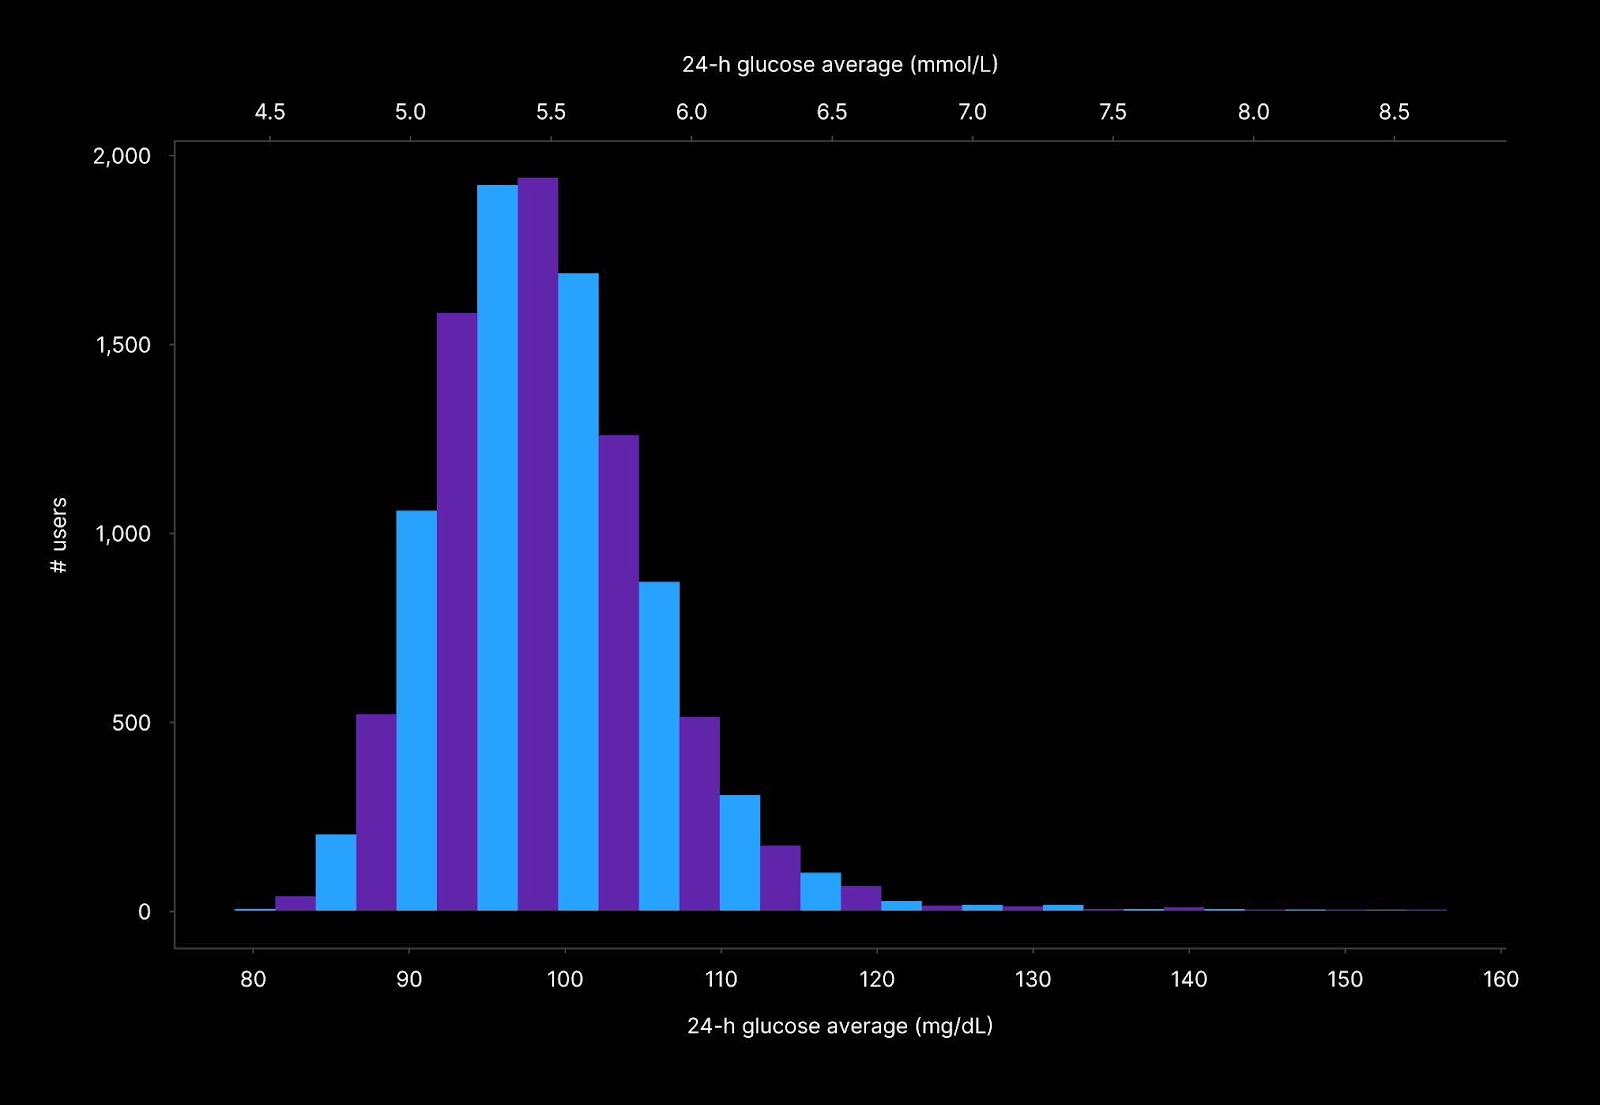
85% of people have an average daily glucose between 90-110 mg/dL.
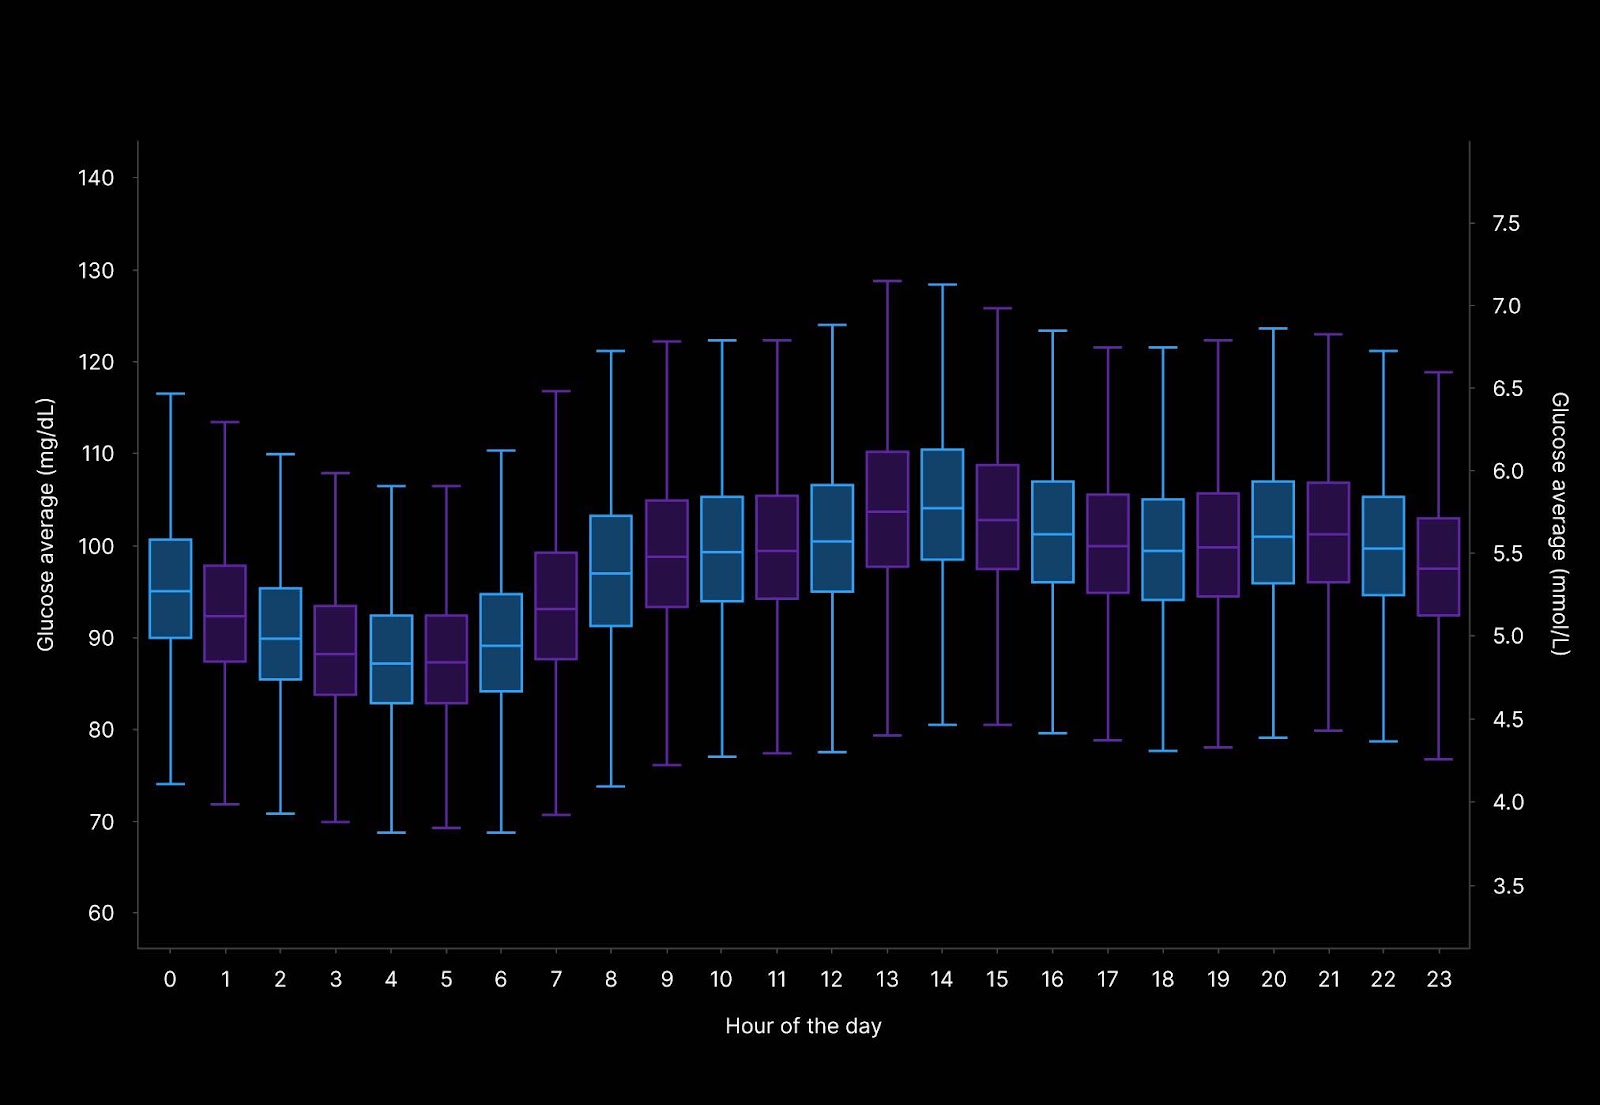
Note this does not mean they do not leave this range but this is just their daily average. In fact you can see below in figure 2 that as a population there is a fluctuation across the day, given the size of the sample, this is a truly strong signal to not get washed out.
Highs and Lows
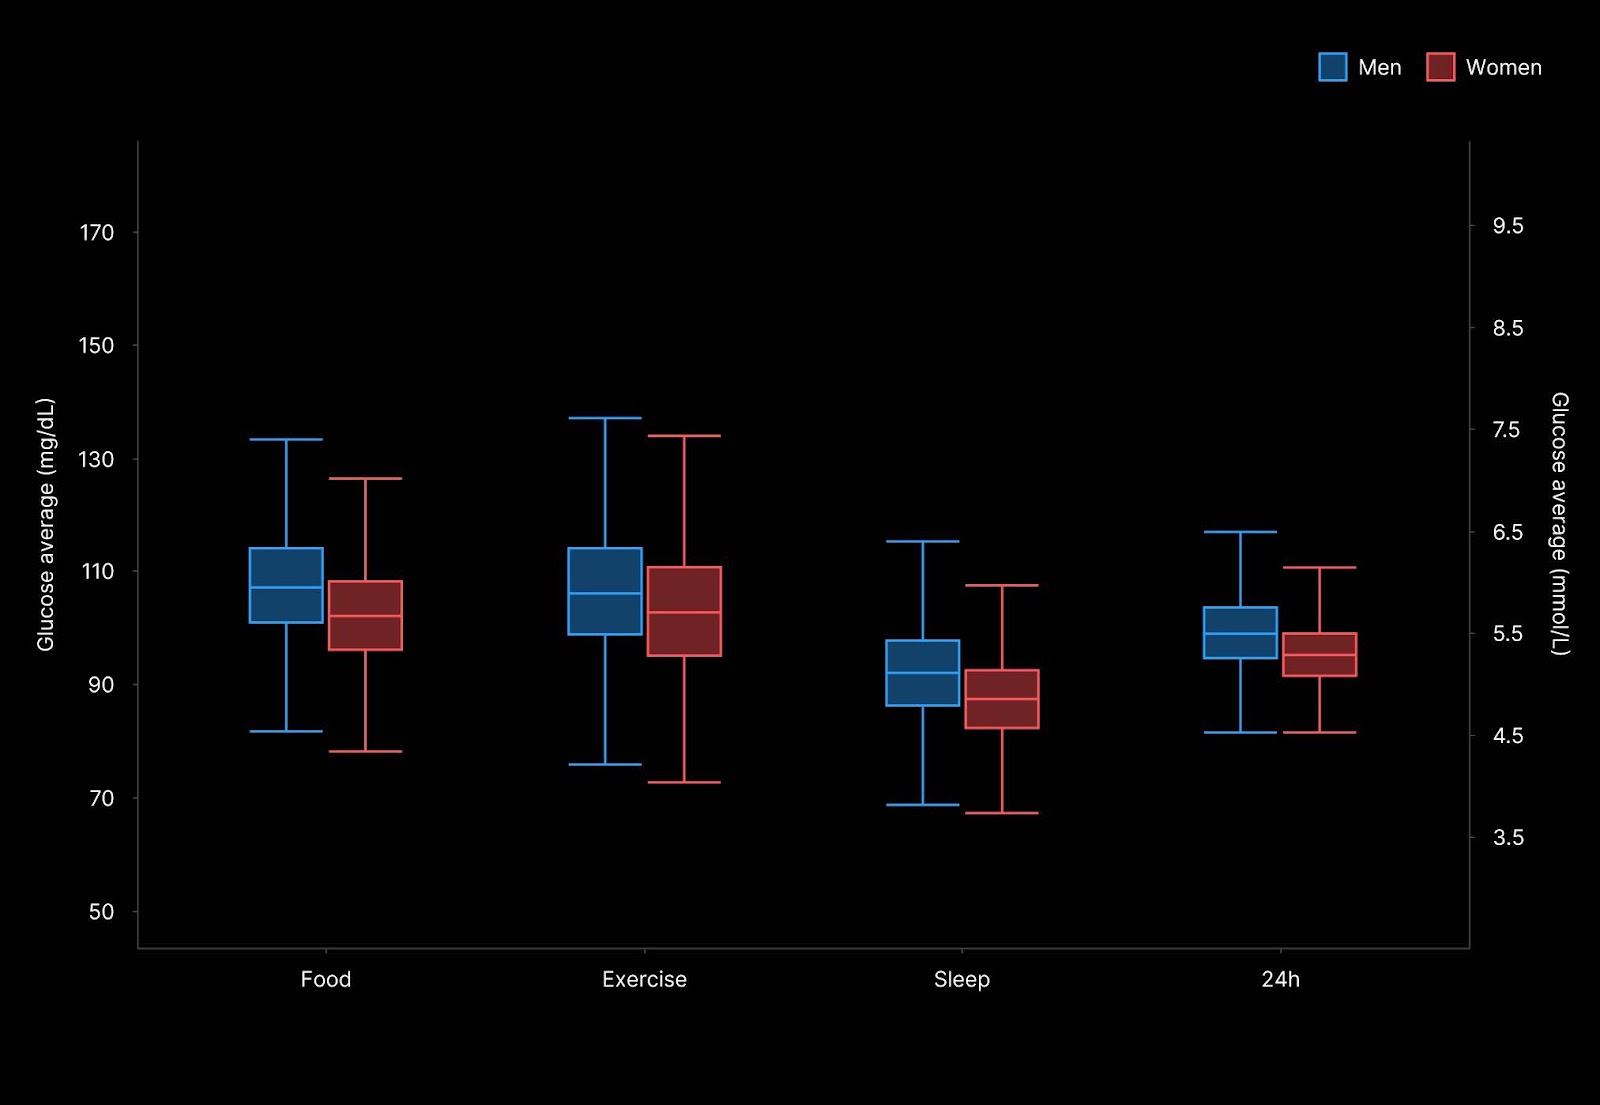
The highest glucose levels were associated with meals and exercise whilst the lowest glucose levels were associated with sleep, likely just prior to awakening as detailed in this blog.
On average during exercise 10.3% (± 16.7%) of time was spent above 140 mg/dL and 11.9 (± 11.6%) of time was below 70 mg/dL. Note ‘exercise’ includes the spectrum of easy walking to hard races of duration hours long.
Men vs Women
Average glucose across a day was higher in men (100 ± 11 mg/dL) than women (96 ± 10 mg/dL). This difference was also present during exercise and sleep.
As one may expect, this difference also meant that women spent more time (0.8%) with glucose below 70mg/dL. Overall 3.4% of time was spent with glucose <70 mg/dL, with this occurring on average 5 (± 3) times a day, lasting on average of 11min (± 21mins), slightly longer in women than men.
During exercise, average time delow 70mg/dL was 11.9 (± 11.6%), occuring on average 1.7 (± 1.4) times per exercise bout and lasting an average of 8.3 (± 11.3) min per occurrence.
Similarly, gender differences were reflected in high glucose levels, those above 140mg/dL. On average 3.6 (± 3.9%) of time was spent >140 mg/dL, occuring on average 3.6 (± 2.2) times daily and lasting on average 51.5 (± 57 min). Women spent 1% less time above 140mg/dL than men, with these occurrences being shorter in duration too (41.2 ± 42.8 min vs. 54.6 ± 60.5 min).
During exercise, time >140mg/dL was 10.3 (± 16.7%) of the total time, occurring on average 2.3 (± 2.2) times per exercise bout and lasting on average 11.5 (± 17.4 min)
Fitness Level
Whilst our data science team did a serious amount of work breaking out the data into subgroups via reported BMI, age and fitness level (aside from the above dissection of data split by gender) mostly there weren’t marked differences between groups. This was likely due to the large number of users in the data set which can at times wash out some of the differences.
One difference that was apparent, though, was the apparent impact of training frequency on glucose during exercise. There was a seeming increasing average glucose during exercise as users exercised more frequently. This may be a reflection of intensity, fueling during exercise or a metabolic difference.
Average glucose levels during exercise events for different training level groups:
Expertise Average Glucose During Exercise
Beginner (1819 = 15%) 102 ± 14 (87–118)
Intermediate (4147 = 33%) 105 ± 13 (91–121)
Advanced ( 3914 = 31%) 107 ± 12 (94–122)
Expert (1506 = 12%) 112 ± 12 (98–128)
Not Reported (1118 = 9%) 107 ± 15 (90–125)
Note: Beginner = exercise 1-2 workouts/wk, Intermediate = exercise 3-4 workouts/wk, Advanced = exercise 4-5 workouts/wk , Expert = exercise >5 workouts/wk
Superaspiens’ Take
- We are exceptionally proud of our science team, the work they do and the way they are aiding the scientific community’s understanding of glucose in people without diabetes.
- The large ranges for many of the averages seen reflect the individual differences in glucose metabolism amongst other factors that impact glucose.
- This article should help people better understand the average CGM user without diabetes to better understand where they are in the spectrum of normal and abnormal.
References:
- Skroce K, Zignoli A, Fontana FY, Maturana FM, Lipman D, Tryfonos A, Riddell MC, Zisser HC. Real World Interstitial Glucose Profiles of a Large Cohort of Physically Active Men and Women. Sensors. 2024; 24(3):744. https://doi.org/10.3390/s24030744