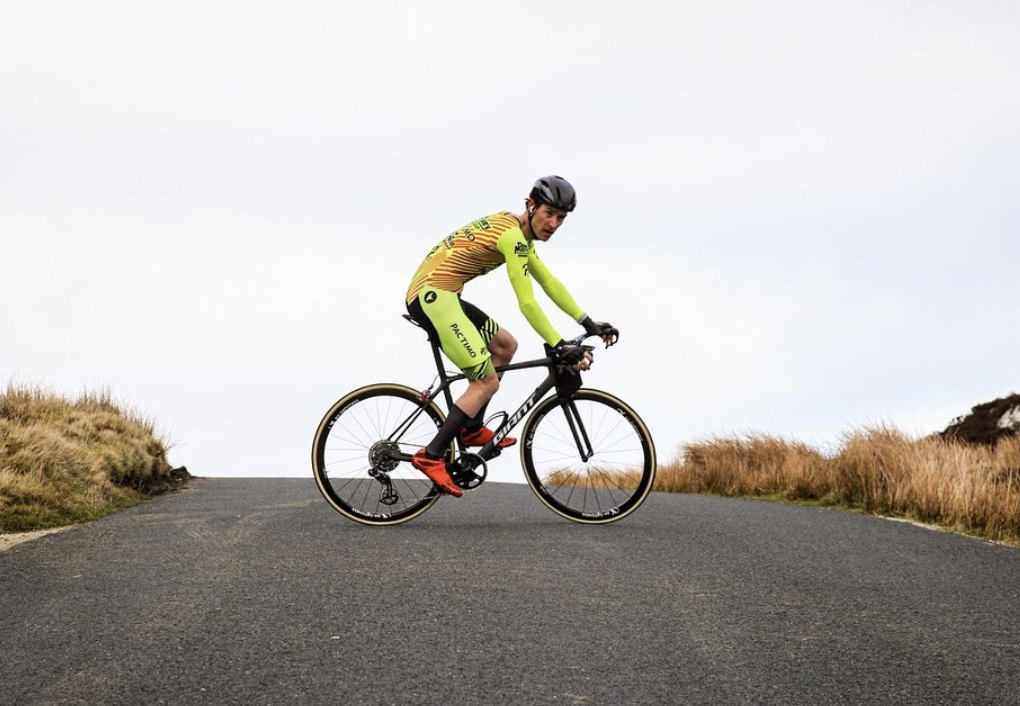
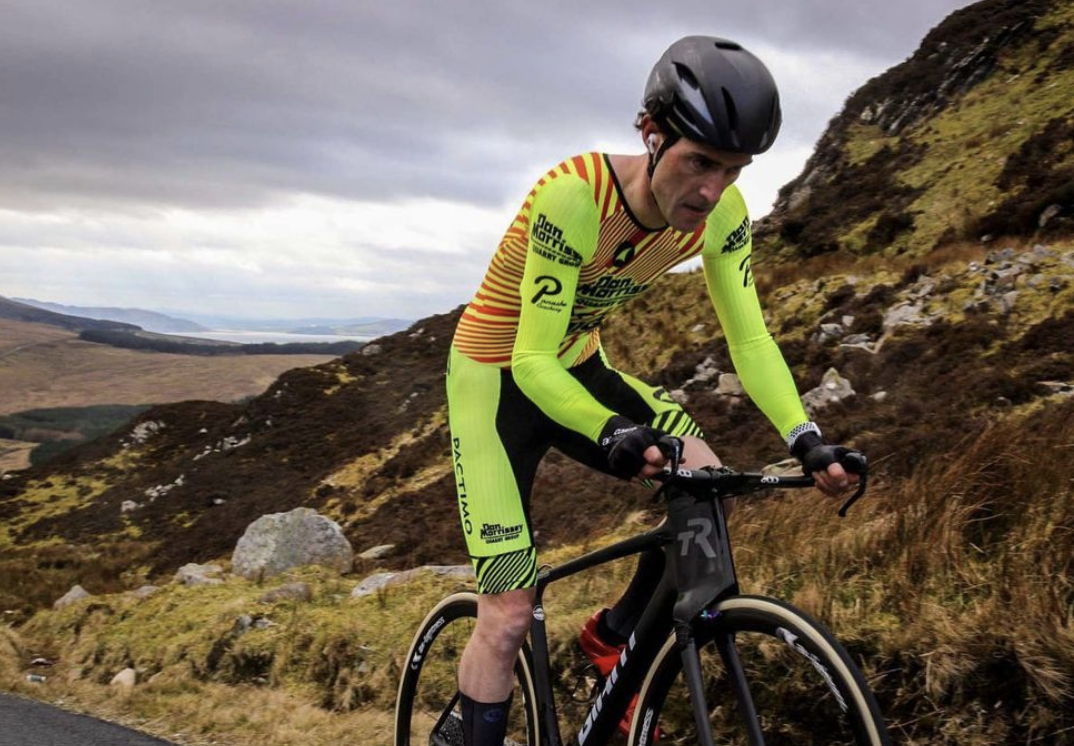
On March 23, 2021, we saw Ronan break the Everesting world record on a bike.
His time – 6:40:54 – was an entire 20 minutes faster than the previous world record and around 24 minutes faster than his own previous attempt in July 2020.
What is Everesting?
Everesting, for the unfamiliar, is a feat of climbing the height of Mt. Everest. In this case, it was riding a bike and within a single attempt. That is 8,848m (29,029 feet) of elevation gain. Overcoming such a challenge requires physical ability, specific training, mental strength, careful planning, and a focused mentality. There have been 16,801 successful Everesting attempts in 107 different countries. Athletes can create their own way to make it through: Pick any hill, anywhere in the world, and complete repeats of it in a single activity until you climb 8,848m.
None have come close to what Ronan has achieved.
His new record was completed on the same ascent as his first record ride: the climb to Mamore Gap in the Northern reaches of Ireland. Ronan performed this unbelievable feat on an 810m segment of straight road with an average gradient of 14.2%, climbing 117m per ascent. To save you from doing the math on this, that’s just over 76 laps. But of course, Ronan did 78 for good measure. He covered 126km for his 8,848m of elevation gain.
What did Ronan’s climb look like?
An average power of 296 watts (6 watts higher than his previous attempt) is perhaps even underestimated due to riding a few laps on a different bike without a power meter.
With an average heart rate of 154bpm, Ronan spent 90 minutes between 155bpm and 160bpm, which includes well over 2 hours between 160bpm and 165bpm.
You read that right: Over six and a half hours of riding, with more than three and half hours within 20 beats of his threshold heart rate.
And over 70% of his time on the bike was spent between tempo intensity and VO2max. This is effectively an interval workout of five to five and a half minutes while climbing, and using the ride down as recovery.
Maintaining such high relative intensity for that long requires an insanely high rate of energy turnover, coming from glucose oxidation. Ensuring a proper glucose supply to the working muscle is crucial for this caliber of effort. At this intensity, the body can burn up to 5g of carbohydrates per minute. Consequently, the body requires significant endogenous (glycogen stores) and exogenous (fuel intake) glucose that, if not carefully approached, might also create GI stress and discomfort. Careful planning and data experimentation was a key element in achieving such performance.
How do you fuel such an effort?
By the look of Ronan’s data below, very well!
Ronan fueled consistently throughout the ride, made logistically easier given the ability to consume fuel on the downhills, every five to five and half minutes. He has admitted to having a strong stomach, but in a challenge to current upper limits of what is believed to be possible, his intake was in the vicinity of 145g/hr of carbohydrates (guidelines suggest that 90g/hr is the recommendation for activities beyond 2.5 hours but some more recent research has emerged of intakes up to 120g/hr, showing some benefits to recovery and fatigue). His choice source was predominantly fluid based, making his absorption a little easier, but also aided in his hydration.
There is a difference between the amount of carbohydrates ingested and how much of it will be oxidized (a chemical energy-liberating reaction) in the muscle cell to produce energy. Maximizing the ability to oxidize what we ingest is one of the key aspects to enhance performance. The ability to sustain such a constant glucose level as we see in Ronan’s live data could potentially indicate a balance between what he was ingesting (supply) and what was used for energy purposes (oxidation).
But there’s no simple means to individually understand and measure what has been defined as the oxidation efficiency (the ratio between exogenous carbohydrates ingested versus oxidized).
100% efficiency means that all the ingested load will be oxidized. The estimated maximum efficiency that the human body has is around 85%. Meaning that ingesting 100g of carbohydrates will result in an oxidation of 85g. However, carbohydrate oxidation efficiency also depends on ingestion rate. Peak efficiency is reached at an ingestion rate of 0.8g/min of simple carbohydrates. Above that, efficiency decreases in an almost linear manner. At an ingestion rate >1.0g/min, efficiency is around 65%. The rest will be either stored as glycogen (liver and muscle), as fat, or will go through other metabolic pathways. Another factor is individual athlete’s characteristics and the fuel type: their training status and a mixture of different carbohydrate sources can significantly increase such peak value.
This is how he consumed over 2g/kg/hr of carbohydrates:
More specifically across the effort, Ronan consumed roughly:
- 500ml/hr SIS beta fuel (80g carbohydrates)
- 1 SIS go gel/hr (22g carbohydrates)
- 5-6 SIS caffeine gels, including one on the start line (150mg caffeine and 21g carbohydrates each)
- 4 energy bars (43g carbohydrates each)
This equates to 143.5-146.68g/hr of carbohydrate.
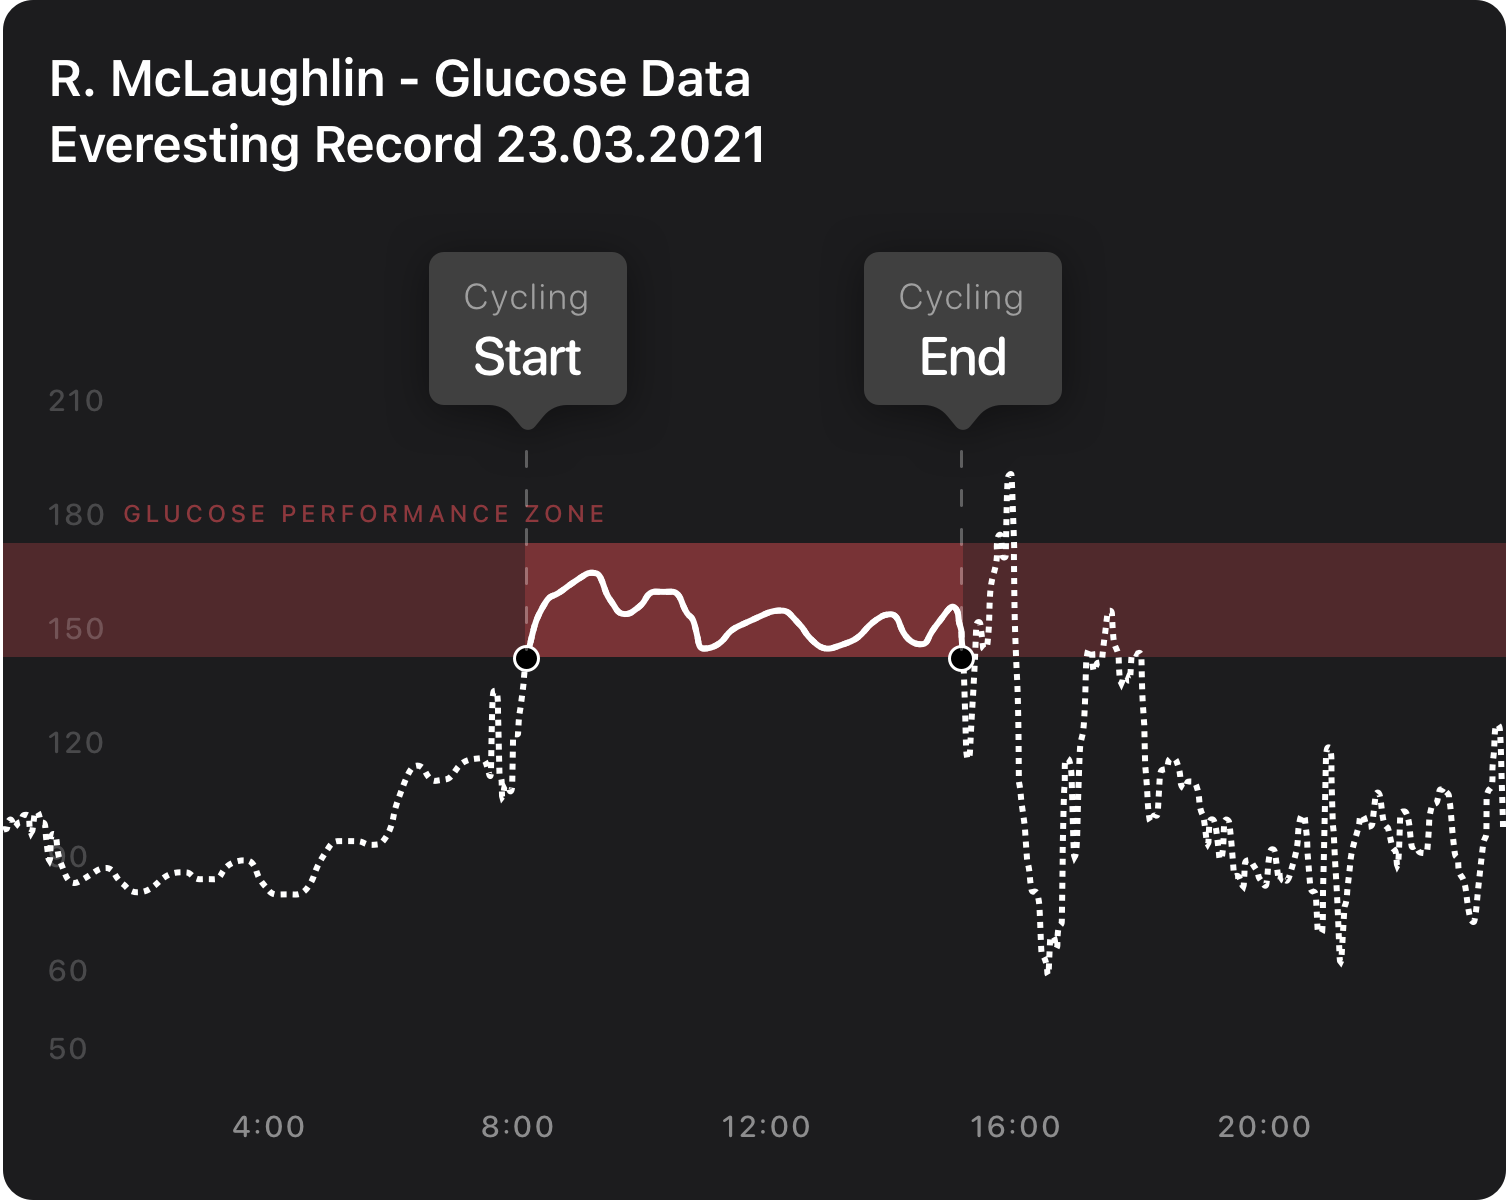
Looking at the trace from the Everesting attempt (Figure 1 and 2), there are some really interesting insights:
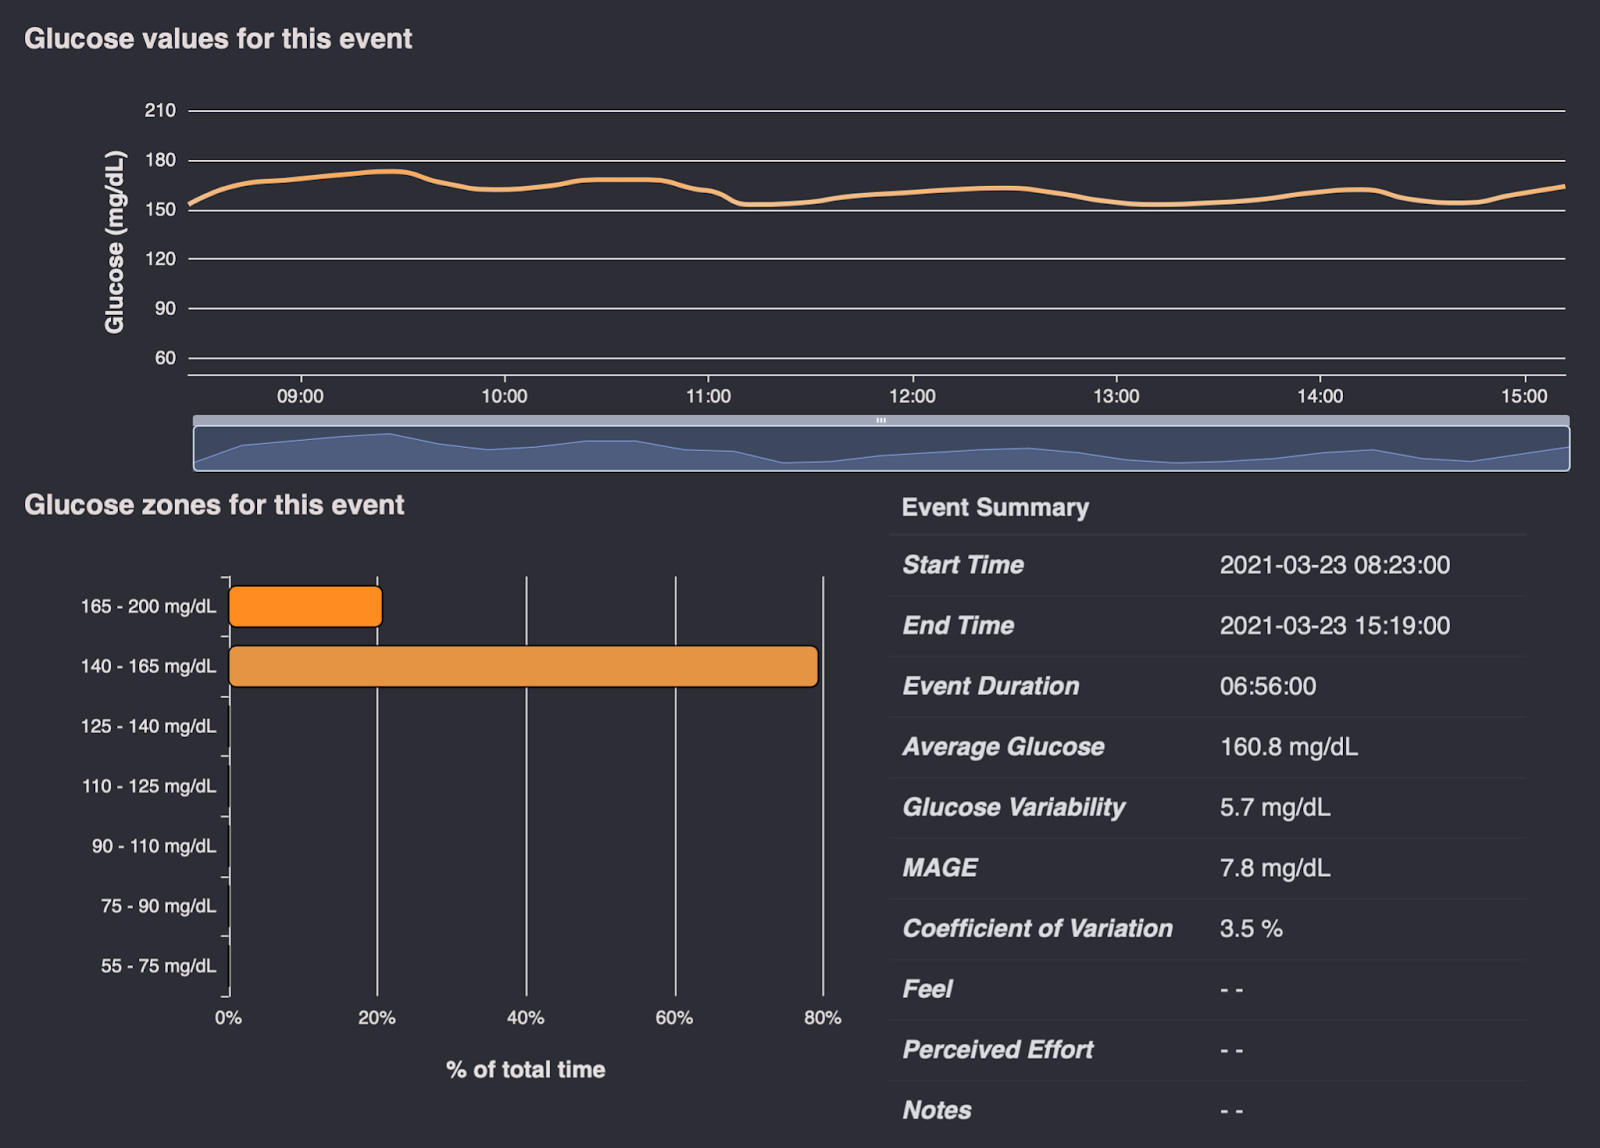
- Ronan had an average glucose of 160.8 mg/dL with a stability of only 3% during his attempt. This helped ensure a constant glucose delivery to the working muscles while preventing liver glycogen disposal (Figure 2).
- You can clearly see the effects of both the active warm up and some pre-event nerves that caused some mini spikes just before the start of the event (Figure 3).
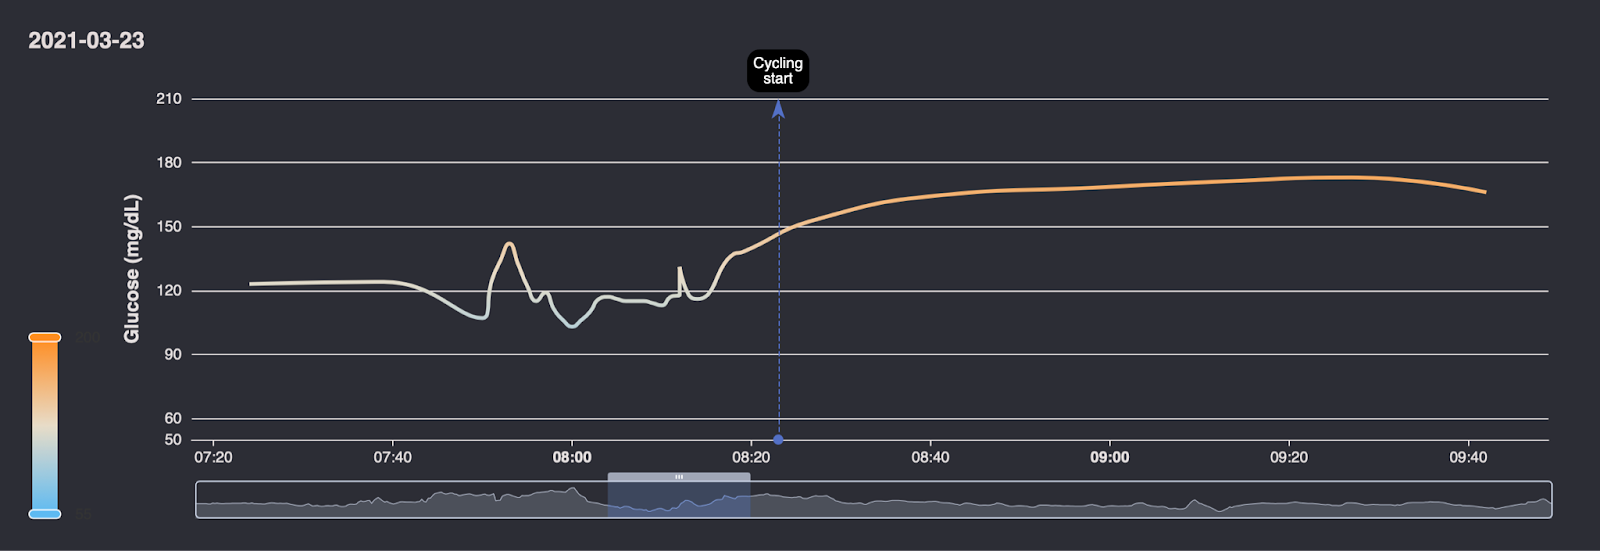
From Figure 3, it’s also clear how Ronan wisely started feeding with carbohydrate before the start of the Everesting to maximize the glucose oxidation efficiency when needed.
Glucose oxidation (“biological burning”) is the process to obtain the energy needed to sustain work capacity from carbohydrates. The typical time-pattern of exogenous (ingested) glucose oxidation rates is not immediate and needs time. Five minutes following ingestion, it is possible to see the appearance of ingested glucose traces in the blood. However, during the first 75-90 minutes from ingestion, carbohydrates oxidation will continue to rise after a plateau is reached.
Taken together, these results imply that not only the rate of oxidation of ingested carbohydrates is important, but also that our body needs time to reach maximum capability to oxidize carbohydrates. The feeding schedule should be such that high exogenous glucose oxidation rates are achieved as soon as possible after the onset of exercise and the amount of carbohydrates ingested should be sufficient to maintain high oxidation rates.
- Perhaps the most informative aspect of the data output is that Ronan’s glucose levels were so high and only diminished slightly across the 6 hours and 40 minutes and were exceedingly stable. This was surely a piece of the puzzle that aided in Ronan’s amazing performance. The maintenance of relatively high and stable glucose levels in such a scenario, seems to favor and promote muscle glucose oxidation, therefore playing a potential key role in exercise capacity and tolerance.
- Post ride (Figure 4), there is a very apparent spike in Ronan’s glucose data. While it is hard to definitively attribute to a single cause, this was most likely a mix of adrenaline/excitement, a banana he ingested right after the event ended, and a good supply of glucose still being delivered by his body for use (positive flux).
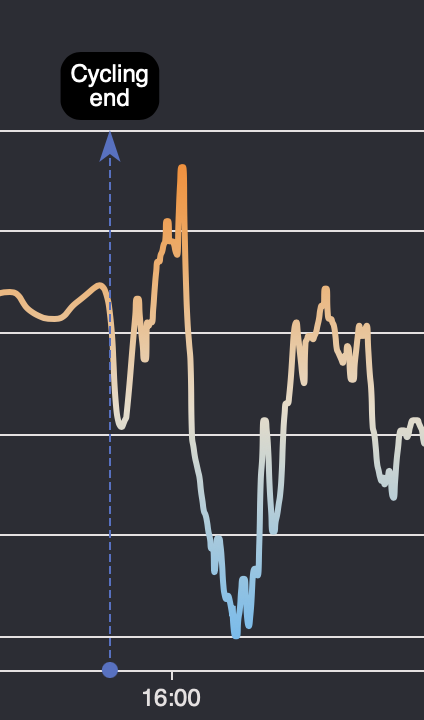
An unsurprising crash follows this, most likely resulting from the mixture of glycogen depletion (Yes, even with his fueling, research suggests it would still have depleted his muscle glycogen stores significantly and an insulin rush to combat the large spike in absence of physical activity.)
- Ronan makes a clear attempt to refuel post-ride, though the hypoglycemic events afterward are unsurprising given the efforts of the day and perhaps a celebratory drink or two.
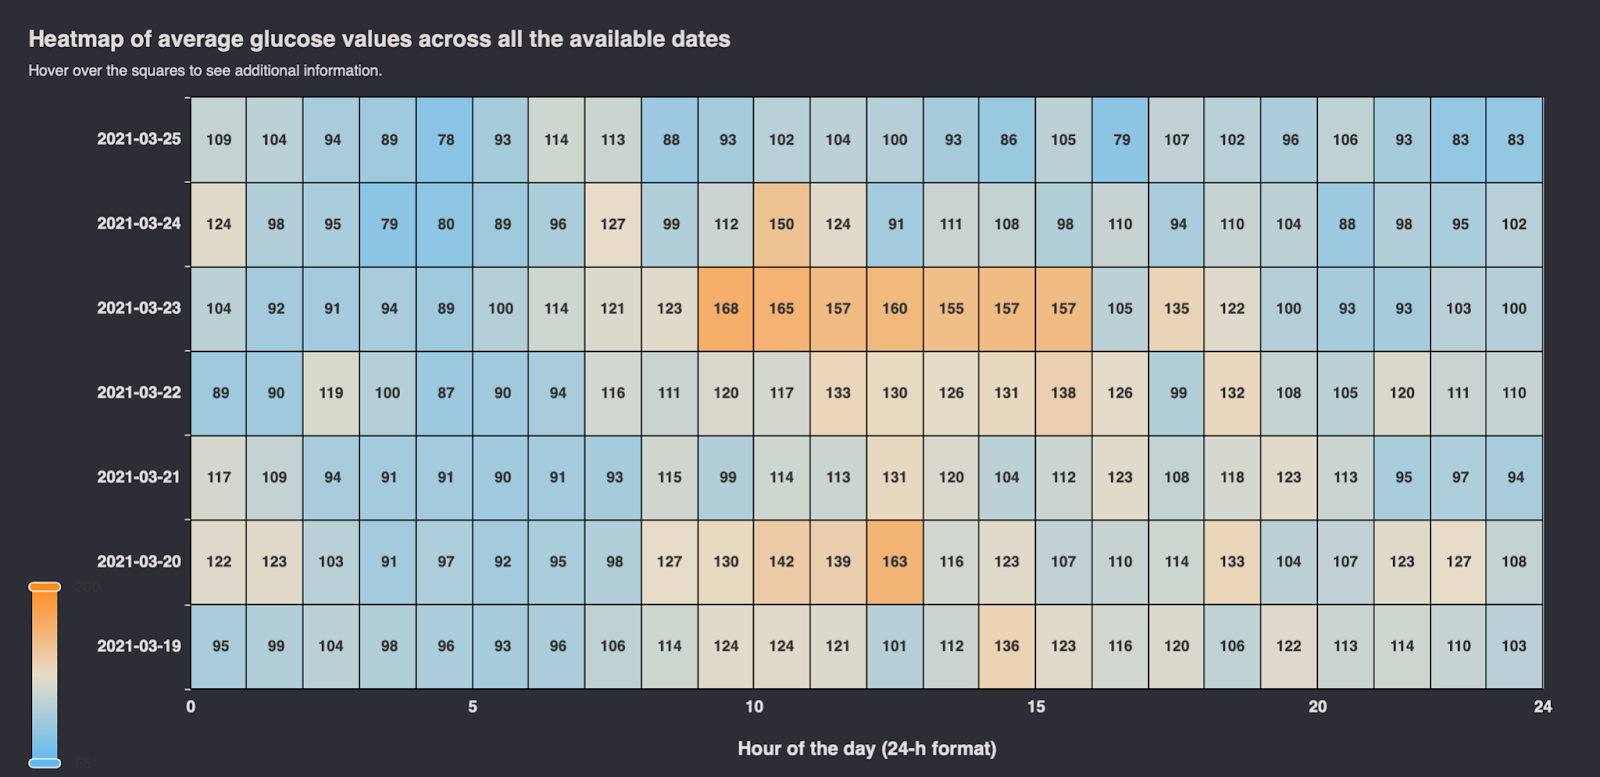
- Examine the strategy used in the days leading up to the Everesting attempt (Figure 5). Looking at Figure 5 and at the color of each cell (which represents the average glucose level per hour), we can see how Ronan’s average glucose data was increased the day before the Everesting attempt (more orange cells throughout the day). This equated to a 12h Trailing Average Glucose of 110 and 24h Trailing Average Glucose of 119 (with impressively low stability given this). We can also easily see the half Everesting attempt that Ronan did as a testing trial on March 20th.
Our Takeaways:
The key learning from this event is that Ronan made a very conscious decision to fuel at this rate, and prepared a data-backed plan to execute on it.
The biggest part of this plan? Train for it.
Ronan actively fueled at this rate in an attempt to ensure that his body could tolerate it.
In addition, what Ronan showed in terms of glucose levels and glucose control was something that was not possible to observe without continuous glucose visibility. Such a unique data pattern challenges the status quo and the understanding behind the role of glucose in promoting high-intensity performances.
This gets us to some interesting scientific questions. Are high level endurance athletes capable of consistently sustaining high circulating glucose levels? Does this pattern highlight a unique characteristic/specificity? Might the concept of the “athletic glucotype” exist?
The only thing that would have made Ronan’s performance even easier on that day? Aside from not getting a huge flat tire? If he had real-time glucose data on his bike head unit so he could make real-time data-driven fueling decisions to stay in his Glucose Performance Zone.
Thankfully, on his next attempt, he will.
And you can too. Come check out all of Supersapiens integrations at supersapiens.com.
Interested in learning more about Ronan? Check out Ronan's Athlete Profile.
REFERENCES:
- Jeukendrup, A. A Step Towards Personalized Sports Nutrition: Carbohydrate Intake During Exercise. Sports Med 44, 25–33 (2014). https://doi.org/10.1007/s40279-014-0148-z
- Viribay, A.; Arribalzaga, S.; Mielgo-Ayuso, J.; Castañeda-Babarro, A.; Seco-Calvo, J.; Urdampilleta, A. Effects of 120 g/h of Carbohydrates Intake during a Mountain Marathon on Exercise-Induced Muscle Damage in Elite Runners. Nutrients 2020, 12, 1367. https://doi.org/10.3390/nu12051367
- Urdampilleta, A.; Arribalzaga, S.; Viribay, A.; Castañeda-Babarro, A.; Seco-Calvo, J.; Mielgo-Ayuso, J. Effects of 120 vs. 60 and 90 g/h Carbohydrate Intake during a Trail Marathon on Neuromuscular Function and High Intensity Run Capacity Recovery. Nutrients 2020, 12, 2094. https://doi.org/10.3390/nu12072094
- Vitale, K.; Getzin, A. Nutrition and Supplement Update for the Endurance Athlete: Review and Recommendations. Nutrients 2019, 11, 1289. https://doi.org/10.3390/nu11061289
- Fell, J Marc et al. “Carbohydrate improves exercise capacity but does not affect subcellular lipid droplet morphology, AMPK and p53 signalling in human skeletal muscle.” The Journal of physiology, 10.1113/JP281127. 26 Mar. 2021, doi:10.1113/JP281127
- Gonzalez, Javier T et al. “Ingestion of glucose or sucrose prevents liver but not muscle glycogen depletion during prolonged endurance-type exercise in trained cyclists.” American journal of physiology. Endocrinology and metabolism vol. 309,12 (2015): E1032-9. doi:10.1152/ajpendo.00376.2015
- Steiner JL, Crowell KT, Lang CH. Impact of Alcohol on Glycemic Control and Insulin Action. Biomolecules. 2015;5(4):2223-2246. Published 2015 Sep 29. doi:10.3390/biom5042223
- Carter, James M et al. “The effect of glucose infusion on glucose kinetics during a 1-h time trial.” Medicine and science in sports and exercise vol. 36,9 (2004): 1543-50. doi:10.1249/01.mss.0000139892.69410.d8